

A new method for monitoring the Nankai Trough megathrust subduction zone ~Paper published in "Nature Communications"~
A research group of University of Shizuoka and Shizuoka University succeeded in estimating the state of the stress in and around the focal region of the Nankai Trough megathrust earthquake by conducting statistical analysis of the seismic activity (Fig. 1). This group says that there is a possibility that it may lead to a method to evaluate whether the next Nankai Trough earthquake is approaching or not. On March 16, 2018, their paper has been published in "Nature Communications", a peer-reviewed open access scientific journal published by the Nature Publishing Group.
The study was led by Dr. Kazuyoshi Z. Nanjo, Project Associate Professor and the Leader of Division for Earthquake Prediction Research, Global Center for Asia and Regional Research, University of Shizuoka, in collaboration with Dr. Akio Yoshida, Visiting Professor of Center for Integrated Research and Education of Natural Hazards, Shizuoka University. This work was partially supported by JSPS KAKENHI Grant Number JP 17K18958.
Generally, smaller earthquakes occur more frequently than larger ones. The research group focused on the fact that the relationship between the magnitude and frequency of such earthquakes deviates from the average one, depending on the structural heterogeneity of the Earth's crust and the state of the stress (more precisely, differential stress). They analyzed the earthquakes of the past 10 years in and around the anticipated focal regions along the Nankai Trough, and examined the distribution of "b value" showing the deviation from the average relationship. See also 《Memo》 for a brief explanation of b value. It is found that the lower the b value (the larger proportion of large earthquakes to small ones), the higher slip-deficit rate. This is interpreted as an indication of larger differential stress for higher plate-boundary stickiness.
In particular, the b value is relatively low in the focal region where the Tonankai earthquake occurred in 1944 and in the focal region where the Nankai earthquake occurred in 1946, and it is relatively high in the middle region. Harmonious results were obtained in coordination with the results by the Japan Coast Guard announced in 2016, who used the data of the ocean-bottom crustal movement, independent from seismicity used by Nanjo and Yoshida in this study. By monitoring the change in the b value, there is a possibility to capture the change in differential stress applied to the plate boundary.
Moreover, the b value for the areas of high slip-deficit rates in the eastern part is lower than that in the western part, indicating that differential stress on asperities in the eastern part is higher than that in the western part. This may explain the history of the Nankai Trough earthquakes, in which the eastern part tends to rupture first.
The 2011 off the Pacific coast of Tohoku Earthquake that caused the Great East Japan Earthquake ("Higashi Nihon Daishinsai" in Japanese) showed that the b value of the focal region decreased prior to the occurrence of the main shock. "The possibility of evaluating the preparation process to the occurrence of a megathrust earthquake along the Nankai Trough using the b value index has likely come out", said Nanjo.
《Memo》 "b value" indicating the relative proportion of the number of small earthquakes and large earthquakes, obtained by statistical processing of seismic activity. The b value decreases as the number of relatively large earthquakes increases. It is said that it may reflect the structural heterogeneity of the Earth's crust and the state of the differential stress. For example, when the occurrence of a large earthquake is approaching, a large differential stress is applied to the Earth's crust and the plate boundary strongly, so that a small earthquake is hard to occur and a decrease in b value may be observed.
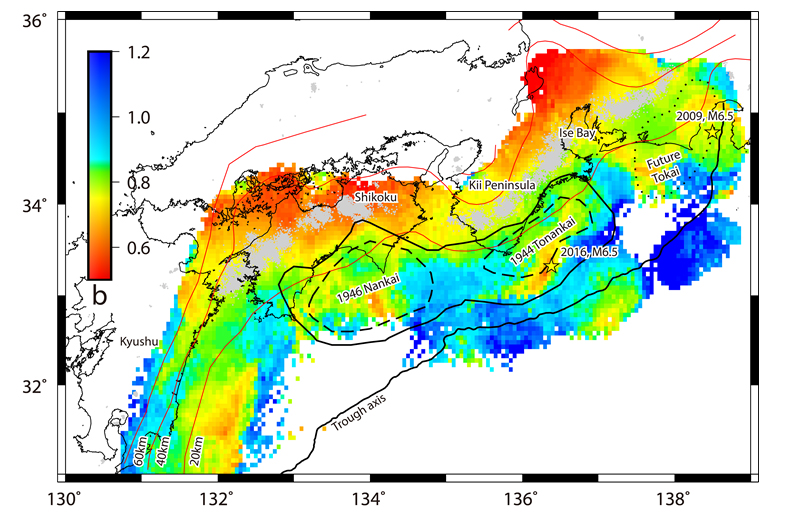
Fig. 1. Map of b values.
Dotted line delineates a region supposed to be sources of the anticipated Tokai earthquake. Solid and dashed lines denote the regions of estimated large slips (>2 and 4 m, respectively) resulting from the 1946 Nankai and 1944 Tonankai earthquakes. Grey dots show low-frequency earthquakes. Red curves mark depth contour lines. Also see this paper for details.
Paper
Author: Nanjo, K. Z. and Yoshida, A.
Title: A b map implying the first eastern rupture of the Nankai Trough earthquakes
Journal: Nature Communications
Volume: 9
Article number: 1117
DOI: 10.1038/s41467-018-03514-3
Link: https://www.nature.com/articles/s41467-018-03514-3
Date: March 16, 2018 (JST)
Title: A b map implying the first eastern rupture of the Nankai Trough earthquakes
Journal: Nature Communications
Volume: 9
Article number: 1117
DOI: 10.1038/s41467-018-03514-3
Link: https://www.nature.com/articles/s41467-018-03514-3
Date: March 16, 2018 (JST)
About Nature Communications
Nature Communications is an open access, multidisciplinary journal dedicated to publishing high-quality research in all areas of the biological, physical, chemical and Earth sciences. Papers published by the journal aim to represent important advances of significance to specialists within each field.
The 2016 journal metrics for Nature Communications are as follows.
2-year Impact Factor: 12.124; 5-year Impact Factor: 13.092; Immediacy index: 1.993; Eigenfactor® score: 0.72229; Article Influence Score: 5.732; 2-year Median: 8
The 2016 journal metrics for Nature Communications are as follows.
2-year Impact Factor: 12.124; 5-year Impact Factor: 13.092; Immediacy index: 1.993; Eigenfactor® score: 0.72229; Article Influence Score: 5.732; 2-year Median: 8
Related links
Nature Communications
https://www.nature.com/ncomms
Global Center for Asian and Regional Research, University of Shizuoka
http://global-center.jp/
Center for Integrated Research and Education of Natural Hazards, Shizuoka University
http://www.cnh.shizuoka.ac.jp/
https://www.nature.com/ncomms
Global Center for Asian and Regional Research, University of Shizuoka
http://global-center.jp/
Center for Integrated Research and Education of Natural Hazards, Shizuoka University
http://www.cnh.shizuoka.ac.jp/
Contact for this study and press release
Kazuyoshi Z. Nanjo, Division for Earthquake Prediction Research, Global Center for Asia and Regional Research, University of Shizuoka
E-mail: nanjo@u-shizuoka-ken.ac.jp
E-mail: nanjo@u-shizuoka-ken.ac.jp
3/28/2018